Built for the Morning Check

All the Key Insights You Need
Recent Communications
Channel Performance
Top Performers and Top Earners
ROI Trends and Lead Generation
Audience Behavior
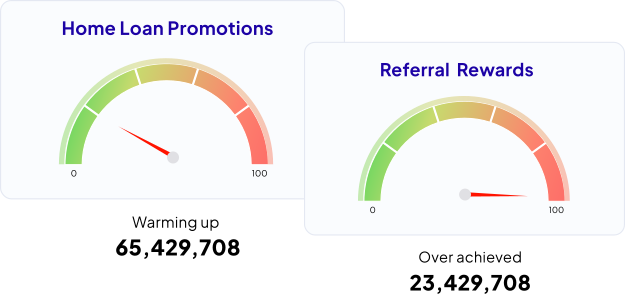
Recent Communications
See how recent communications are performing against their goals, whether they are warming up, achieving, or overachieving, scored from 0 to 100 against reach, engagement, or conversion targets.
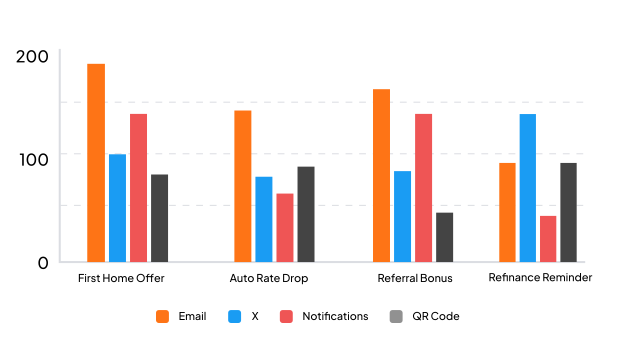
Channel Performance
See which channels are driving results. Track reach, engagement, and conversion by channel so you know where to invest and where to pull back.
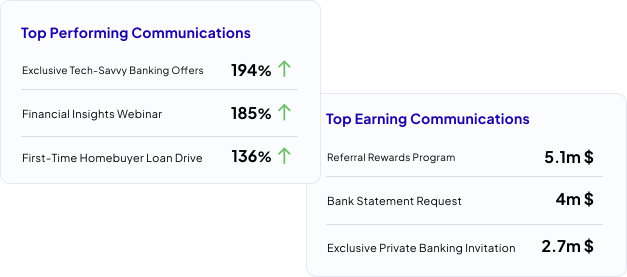
Top Performers and Top Earners
See the five best and five worst communications by goal achievement and by ROI. Know what is winning and what needs attention.
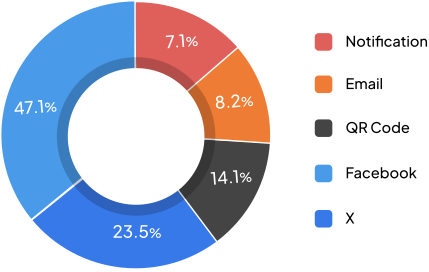
ROI Trends and Lead Generation
See where revenue is coming from and where leads are entering your funnel. Track both by channel and over time in one campaign performance dashboard.
Audience Behavior
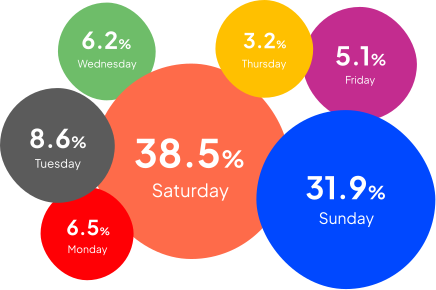
See the days and hours your audience is most active, how long it takes leads to convert, and where your most engaged audiences sit so you can plan with more precision.
Why the Dashboard Is Different
Performance in Context, Not in Isolation
Every metric is tied to a goal or benchmark. You do not just see numbers. You see whether performance is on track.
One Page, Not Ten Reports
This dashboard brings together audience engagement, ROI, channel performance, audience behavior, and communication performance in one view.
Click Any Number and Go Deeper
Every widget leads into the full analytics experience. Drill into a communication, a channel, or an individual profile.
Updated Continuously
Numbers refresh as activity happens, so what you see this morning reflects what happened overnight.
Start Your Day Here
See how the RESUL audience engagement dashboard gives you a complete view of communication performance in under a minute.
Frequently Asked Questions
The Dashboard is the fastest way to see engagement, conversion, revenue, ROI, and channel performance in one place.
It is built for decision makers and marketers that need a quick daily read on communication performance, emerging issues, and where to focus next.
You can see recent communications, top and bottom performers, ROI trends, leads generated, audience behavior, and channel performance at a glance.
No, every widget is a starting point. You can click into communications, channels, and deeper analytics views for more details.
Yes, the Dashboard shows trends across 30, 90, and 180-day windows so you can see whether performance is improving or fading.
Metrics are paired with goals, benchmarks, or recent trends so teams can understand whether numbers are simply high or actually performing well.
No, it is connected to the wider analytics layer, so you can move from a summary view into detailed reporting without switching systems.